The DNA was extracted from the cells contained in the blood and buccal swab samples collected during the Sampling phase. The extraction was performed by using different solutions which provoke the swelling and bursting of cells with the consequent release of genetic material. The extracted total DNA was made ‚Äč‚Äčavailable for the genetic analysis of mitochondrial DNA, Y-chromosome and autosomal markers.¬†
Mitochondrial DNA analysis
The analysis of the mitochondrial DNA focused on the study of the sequence of an entire fragment (around 650 base pairs) of the hypervariable region, so called due to its high mutation rate. Moreover, 17 loci (SNPs or Single Nucleotide polymorphisms) of the more stable coding region of the mtDNA (with a lower mutation rate) were analyzed. 
From the total DNA that had been previously extracted , a fragment of the mtDNA was amplified to a million copies through the Polymerase Chain Reaction (PCR) technique. The sequences of the nucleotides (A= adenine, T= thymine, C=cytosine and G=guanine ) for the 650 base pairs considered in the project were obtained by DNA sequencing techniques .
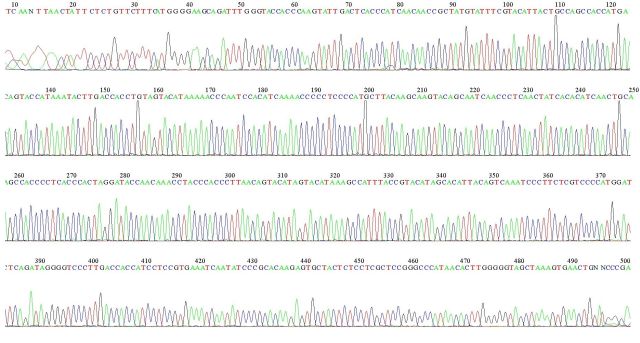
An example of an mtDNA sequence from a donor is reported below. Each peak corresponds to a nucleotide base which is colored differently according to whether it indicates an A, a G, or a C and T.
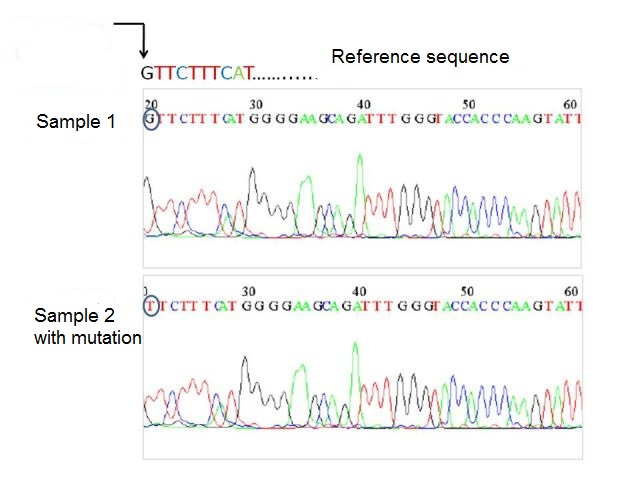
Each sequence was compared to another sequence that is used by all scientists as a reference for human mtDNA (Anderson sequence), in order to detect possible genetic mutations. For example, if in one specific position of the mtDNA of the sequence reference, there is a G present while in the mtDNA of the sample analyzed, there  is a T present in the same position, this means that in that specific position, a mutation has occurred in the sample (see figure below).
Through the comparison of these differences among individuals belonging to the same or different populations, it was possible to establish their genetic variation and relationships by using appropriate statistical analysis.
Y-chromosome analysis
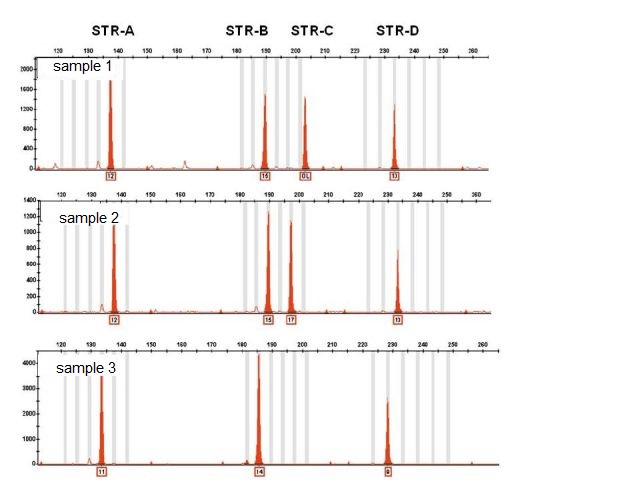
The analysis of the Y-chromosome involved the   study of seventeen genetic markers called microsatellites (STRs or short tandem repeats). These markers are short DNA repeat sequences (consisting of 1 to 5 base pairs) which are repeated in tandem. For example, the  ATTCGATTCGATTCGATTCG  sequence  is a tandem repeat of the base motif ATTCG that repeats itself four times (tetra nucleotide microsatellite). The analysis was performed by using commercially available kits that allow the simultaneous analysis of the 17 STRs in each individual. 
The genetic variability among individuals from differing or the same population consists in the presence of  different numbers of repeats for a given microsatellite.  For example, individual number 3 has  11 repeats for the STR-A microsatellite, while samples 1 and 2 have 12 repeats. The same applies for the STR-B microsatellite for which sample 3 has 14 repeats compared to the 15 which were observed in the other two samples, and so on.
Basic bibliography
Anderson et al., 1981. Nature 290:457-465.


 English
 Italiano

